
You're About to Lock In a Property Decision Worth $1.5M-$3M+
Here's How to Tell If You're Looking at the Right One.
A data-driven checklist that reveals whether a property has genuine room to appreciate, or whether you're buying near its ceiling and won't know until it's too late.
You're About to Lock In a Property Decision Worth $1.5M-$3M+
Here's How to Tell If You're Looking at the Right One.
A data-driven checklist that reveals whether a property has genuine room to appreciate, or whether you're buying near its ceiling and won't know until it's too late.
Singapore's property market feels calmer than it has in years.
Interest rates down. Prices stabilizing. No panic, no frenzy, no cooling measures looming.
For most buyers, this feels like breathing room. Time to think.
But here's the problem with breathing room: it makes buyers less rigorous, not more.
When the market was chaotic, you triple-checked everything. Now that it feels stable, the temptation is to think "anything decent should be fine."
That's where the real risk sits.
Because calm markets don't reduce the gap between properties that appreciate and properties that stagnate. They widen it.
If you're actively weighing up a property decision right now, this guide was built for exactly where you are.
It won't tell you which district is hot. It won't promise you 19% returns.
What it will do is give you three specific checks you can run on any property you're considering,
so you can see whether the numbers support the price you're about to pay,
or whether you're walking into a stagnation trap that only becomes obvious five years from now.
The Singapore property market finally feels calm.
The property market feels calmer than it has in years.
Interest rates down. Prices stabilizing. No panic, no frenzy, no cooling measures looming.
For most buyers, this feels like good news. Breathing room.
Time to think.
But here's something that doesn't get talked about enough:
Calm markets don't reduce the gap between winners and losers. They widen it.
When the market is chaotic, buyers are forced to be careful.
They triple-check everything.
They hesitate before committing.
When the market feels stable?
Complacency sets in.
Buyers start thinking 'the market is calm, so anything I buy should be fine.'
They stop doing the hard analysis.
And five years later, they're wondering why their property barely moved while someone else's appreciated by $400,000.
Who's Behind This Analysis

My name is Greg Tan. I've been in real estate since 2019, but my approach isn't typical.
Before this, I majored in Data Analytics at SMU.
While my classmates went to tech companies, I noticed something in Singapore's property transaction data that changed my direction entirely.
The numbers told a different story than the usual property-related beliefs society held.
Freehold doesn't guarantee profits.
Prime districts don't guarantee appreciation.
MRT proximity doesn't guarantee demand.
The data showed patterns that contradicted what most agents were telling buyers.
So I built a framework around what the transaction data actually revealed.
Not opinions. Not hunches. Exposed patterns.
Here's what that framework has produced:
→ Mr. Tay, a first-time buyer who was told to "wait for clarity" during COVID.
Applied the framework, bought a 2-bedder at Reflections. Currently sitting on $400,000+ in capital gains.
→ Ms. Ang, a property owner whose previous condo sat stagnant for 6 years while rentals barely covered costs.
Applied the framework, bought a 5-bedder at Treasure at Tampines. Sold 4 years later for $734,888 capital gains.
→ Mr. and Mrs. Chia, second-time buyers whose previous launch underperformed.
Applied the framework, bought a 3-bedder at Penrose. Sold 3 years later for $539,888 capital gains.
Now shopping for landed.
Different situations. Different budgets. Different goals. Same underlying framework.
I also have skin in the game.
In November 2024, I bought a 3-bedder new launch in Marine Parade (D15).
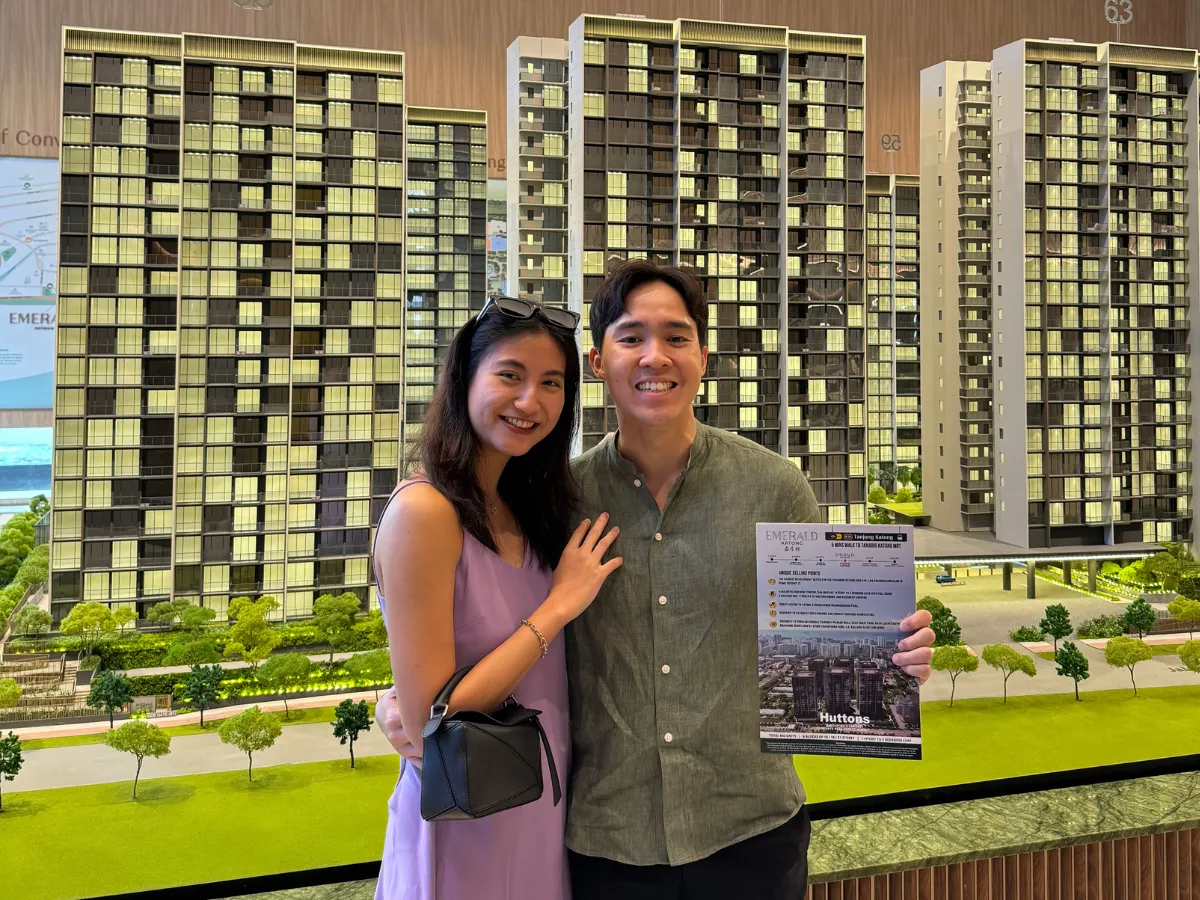
Not as a speculative flip.
As my home with my fiancée.
I applied the same framework I use with clients.
I expect it to appreciate $300K-400K over the holding period based on the same patterns I'll show you in this guide.
I'm not asking you to trust advice I wouldn't follow myself.
Before You Continue, Read This Carefully
This guide is dense. It's built for people who are actively working through a property decision and want to pressure-test their thinking before committing.
This is for you if:
✅ You have a property move you're working toward in the next 3-12 months (MOP approaching, lease situation, family needs, life stage change)
✅ You've started browsing listings or attending showflats but can't confidently tell which ones are genuinely worth their asking price
✅ You have a rough sense of your budget, even if you haven't locked in exact loan figures yet
✅ You want a framework to evaluate on your own, not just an agent telling you "this one is good"
This probably isn't the right time to download if:
❌ Your property move is more than 2 years out. The framework applies across market cycles, but the specific data points and checks in this guide are most useful when you’re close enough to a decision to act on them.
❌ You haven't started thinking about a budget range in mind
❌ You're exploring BTO as your primary option. This guide covers resale and private property analysis. BTO follows a different evaluation framework entirely.
❌ You've already committed to a property and want to feel better about it. The guide is a pre-decision tool, not post-decision reassurance.
The Stagnation Trap Most Buyers Don't See Coming
What this means for the decision you're making right now:
After analyzing thousands of property transactions across Singapore,
certain property categories are showing the exact same signals that preceded previous extended flat periods.
We're talking 5-7 years of minimal appreciation.
Meanwhile, other properties display transaction patterns that historically preceded continued growth, even during broader market slowdowns.
This isn't speculation. It's visible in the data.
With today's record-high purchase prices, a multi-year stagnation means more than just "not making money."
It means potentially:
👉Being trapped in a property that doesn't appreciate during your crucial wealth-building years
👉Making substantial monthly payments with minimal equity growth
👉 Missing out on better opportunities during your prime earning period
👉 Facing challenging exit options when you're ready to upgrade
The uncomfortable truth is that these stagnation signals aren't affecting the entire market.
They're concentrated in properties with specific characteristics that most buyers completely overlook during viewings.
Two properties can look nearly identical during viewings.
Similar locations.
Comparable facilities.
Attractive floor plans.
Reasonable PSF pricing.
But their 5-10 year trajectories couldn't be more different.
The difference isn't obvious through traditional evaluation methods.
What Actually Drives Property Value
(It's Not What You Think)
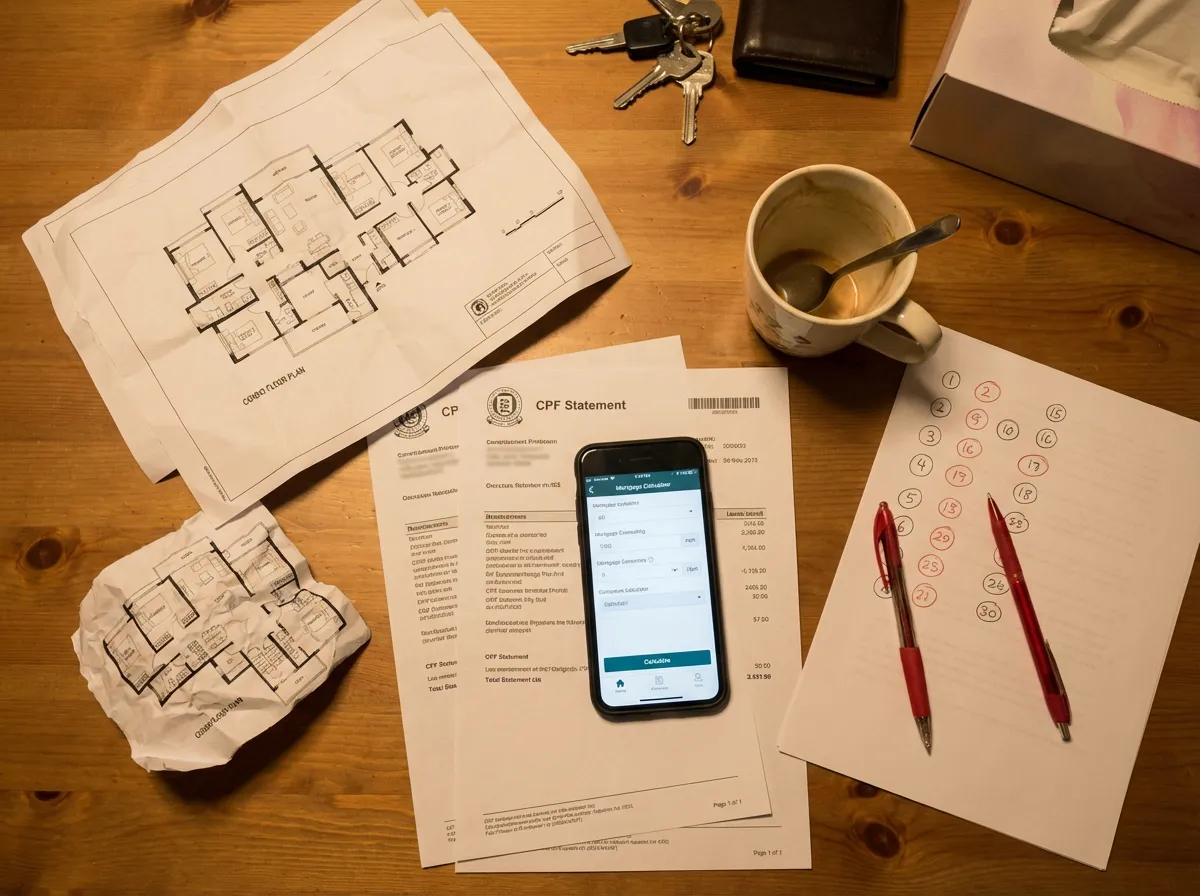
Most buyers evaluate property using a checklist passed down from parents, agents, and colleagues:
⏩ Freehold status
⏩ MRT proximity
⏩ "Hot" district names
⏩ Prestigious developer
⏩ Lower PSF compared to neighbouring developments
The problem? Everyone knows these factors. Which means they're already priced in.
When you compete on information everyone has, you're not finding value.
You're paying market rate for perceived value.
The real opportunities sit in the gaps between what buyers assume matters and what actually drives valuations.
Let me give you two real examples:
Scotts Square.
Freehold. Prime District 9.
Minutes from Orchard MRT.
Premium developer.
On paper, it ticks every box.
An investor there lost over $1 million.
Not because the property was bad.
But because the factors that actually drive appreciation were pointing in a different direction. Factors hiding in transaction data.
Now contrast that with The Minton in Hougang.

99-year leasehold.
Not a "prime" district.
No waterfront views or celebrity architect.
Yet in 2025 alone, The Minton recorded 12 transactions with profits exceeding $1 million each.
Over 20% of its profitable sales that year crossed the seven-figure mark.
Exposed to the same market conditions.
Exposed to the same interest rate environment.
Yet one property trapped its owner in a million-dollar loss while the other generated million-dollar gains, repeatedly, for multiple owners.
The difference doesn't have to be luck. It can be detected from analysis.
What's Actually Happening in 2026
The market conditions right now are creating a specific environment that rewards analytical buyers and punishes complacent ones.

👉 Nearly 13,500 HDB flats are reaching MOP this year.
That's almost double last year's supply.
👉Private home completions are jumping from around 5,200 units last year to approximately 7,000 units this year.
👉 Five new EC projects are launching, compared to just two last year.
👉Interest rates have dropped to 3-year lows, with 3-month SORA around 1.2%, down from over 3% just 18 months ago.
👉HDB resale prices went flat in Q4 2025 for the first time since 2020. Sixteen towns actually saw price declines.
Translation: More supply. Lower borrowing costs. Less urgency.
This is good news if you know how to use it. And dangerous if you don't.
Because when there are more options and less pressure, most buyers become less rigorous, not more.
They spread their attention thin.
They get overwhelmed by choice.
They default to "good enough."
The guide gives you a specific way to cut through that noise:
Three checks that tell you whether a property's price is supported by the data, or whether you're paying a premium the numbers don't justify.
3 Transaction Patterns That
Separate Winners From Stagnators
After studying thousands of transactions across multiple market cycles,
I've identified three specific data patterns that consistently predict which properties will stagnate and which will continue appreciating,
regardless of broader market conditions.
These aren't theory concepts or generic advice about "buying in good locations."
They're specific signals visible in transaction data, government documents, and banking policies that most buyers never think to check.
⏩ Pattern #1: The Gap that Was Hidden

Last year, I sat across from a couple about to walk away from a property in the East.
On paper, nothing screamed "opportunity." The PSF was market rate. The tenure was leasehold. Their agent uncle had already told them to wait.
But when I ran my analysis, something didn't add up.
There was a $350,000 gap between what they would pay and what the property was actually worth based on three specific metrics I track.
Not "potential future value." Not "upside if the area transforms."
A measurable gap that existed right then, hidden in plain sight.
They bought. Within months, comparable units were transacting $200K higher. The gap closed exactly as the data predicted.
Most buyers never see these gaps because they're comparing the wrong numbers.
⏩ Pattern #2: When "Popular" Becomes a Trap
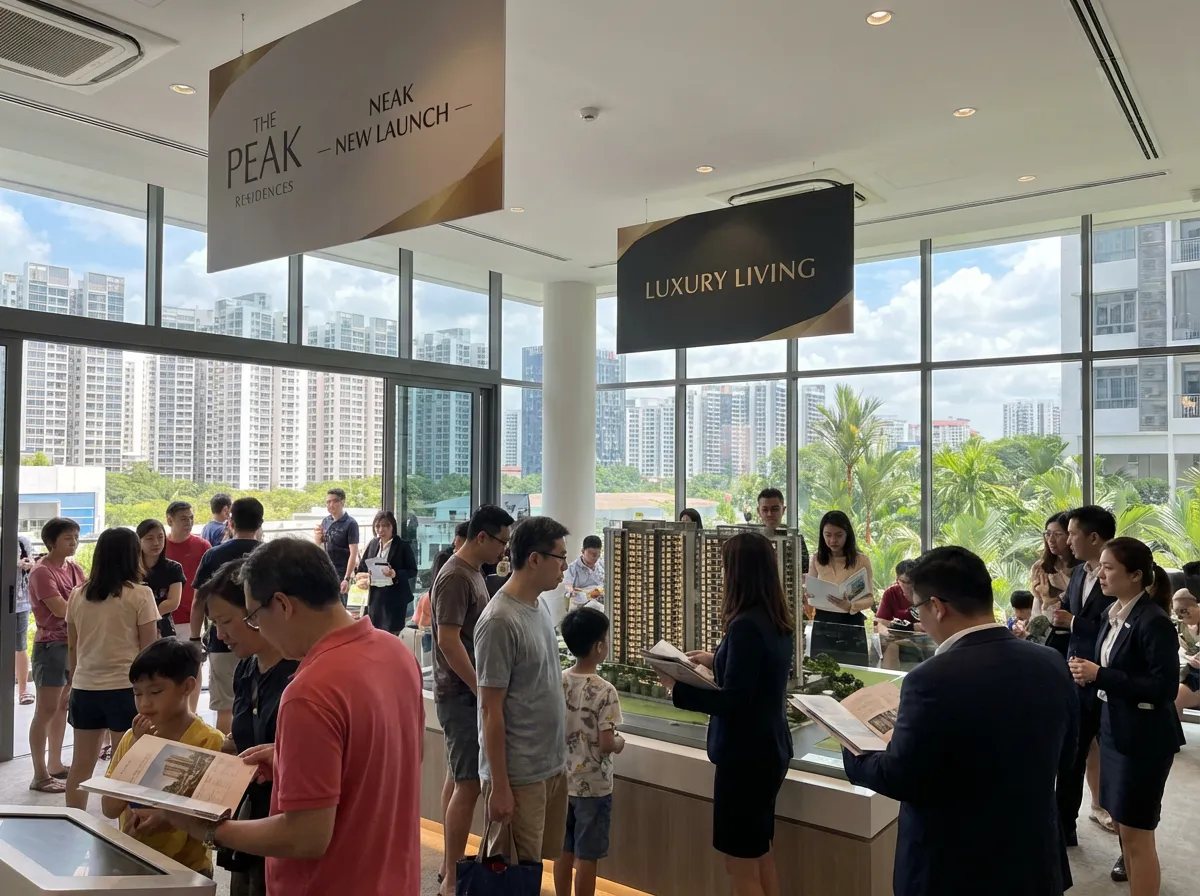
Here's a data point that should make you uncomfortable:
When researchers analyzed the most profitable condos in 2024, every single one of the top 26 developments had at least 500 units.
Not one boutique project made the list.
Yet the general public is being marketed these "exclusive" developments with phrases like "limited units," "premium community," and "more privacy."
What they're not telling you is that the same banks who happily finance these purchases often take a very different stance when you try to sell.
I've watched owners of premium boutique units discover their property valued $200,000-$300,000 below expectations at resale.
There's a specific reason this happens. It's not complicated once you see it. But most buyers only discover it when it's too late.
⏩ Pattern #3: The illusion of "Timing"

Think about the buyers who got into Punggol when everyone said it was "too far" and "too new."
Or those who bought in Paya Lebar before the commercial hub materialized.
By the time transformation is visible, the opportunity is gone.
The profits go to buyers who moved 2-3 years earlier, when the signs were only visible in planning documents most people never read.
Here's the thing:
Those signs weren't hidden. They were published. Available to anyone.
But knowing where to look isn't enough. You need to know what you're looking for, and more importantly, when the data is signaling that prices haven't caught up yet.
Right now, there are areas showing the exact same pattern. Whether you see them depends entirely on whether you know what to look for.
Real Results: Let me share a case that illustrates how these patterns work together.
Mr. Tay, a self-employed professional in his early 30s.
Like many first-time buyers, he faced a familiar dilemma:
Should he "play it safe" with a resale HDB, or take the leap into private property? How could he be sure he wasn't buying near the top?
His concerns might sound familiar:
⏩Uncertainty about whether rates have bottomed, or if there's more volatility ahead
⏩ Fear of over-leveraging in an unpredictable economy
⏩Worry about buying a unit too small to accommodate life changes
⏩ The nagging question: "Am I buying near the peak?"
After applying the three-pattern analysis to various options, we spotted something interesting at a waterfront development that most buyers had overlooked.

While others were fixated on the usual factors, our analysis revealed details that pointed to significant undervaluation.
Today, Mr. Tay's property has accumulated more than $400,000 in paper gains.
A return that surprised even him.
But here's what's important:
It wasn't the views or the architect's name that drove this result.
It was three specific indicators in our analysis that most buyers, and even some agents, completely missed.
The same patterns are appearing again in 2026.
Just last month, I identified developments showing eerily similar indicators.
But these opportunities typically disappear within weeks once they become obvious to the general market.
Why I Created This Framework:

At age 7, I watched my single mother make the hardest decision of her life: selling our family home after a divorce.
What could have been a financial disaster instead became the beginning of a successful property journey over the next 15 years.
Starting with a modest DBSS flat in Woodlands, she charted a careful path upward:
Made her first step to a 2-bedroom condo at Casablanca when others said it was "impossible"
Timed our move to The Minton perfectly despite rising interest rates
Eventually secured an Executive Maisonette for retirement that's now worth $1.2 million
Here's what makes this personal for me:
The Minton, where our family lived, has since become one of Singapore's most consistently profitable condos.
In 2025 alone, it recorded 12 transactions with gains exceeding $1 million each.
The patterns my mother intuitively understood decades ago are the same patterns I've now systematized into a framework anyone can apply.
This wasn't just about property appreciation.
It was about watching my mother transform from a worried single parent into a confident homeowner who secured our future despite starting with limited resources.
That's why I'm passionate about helping families make smart property decisions.
After guiding hundreds of buyers through important purchases, I've developed a system that makes complex property decisions clear and accessible.
Because I know firsthand: the right property doesn't just change your address.
It gives your family the foundation for generational success.
This guide is built for people in one of these situations:
You're an HDB owner approaching or past MOP, trying to decide whether upgrading now makes financial sense or whether you should wait.
You're a first-time private property buyer who's been browsing listings and wants a way to evaluate them beyond what agents and PropertyGuru tell you.
You've been going back and forth on whether 2026 is actually the right window for your move, and you want the data to help you decide.
You're getting conflicting advice from different agents and need a framework you can apply yourself to cut through the noise.
If that's where you are, the guide is below.
P.S. If you're considering a property move in the next 12-18 months, the patterns in this guide are most useful before you start seriously viewing. Once you're comparing specific units, you'll want these checks already in your head.
Copyright 2026. All Rights Reserved.